Monthly Global-Mean Temperatures
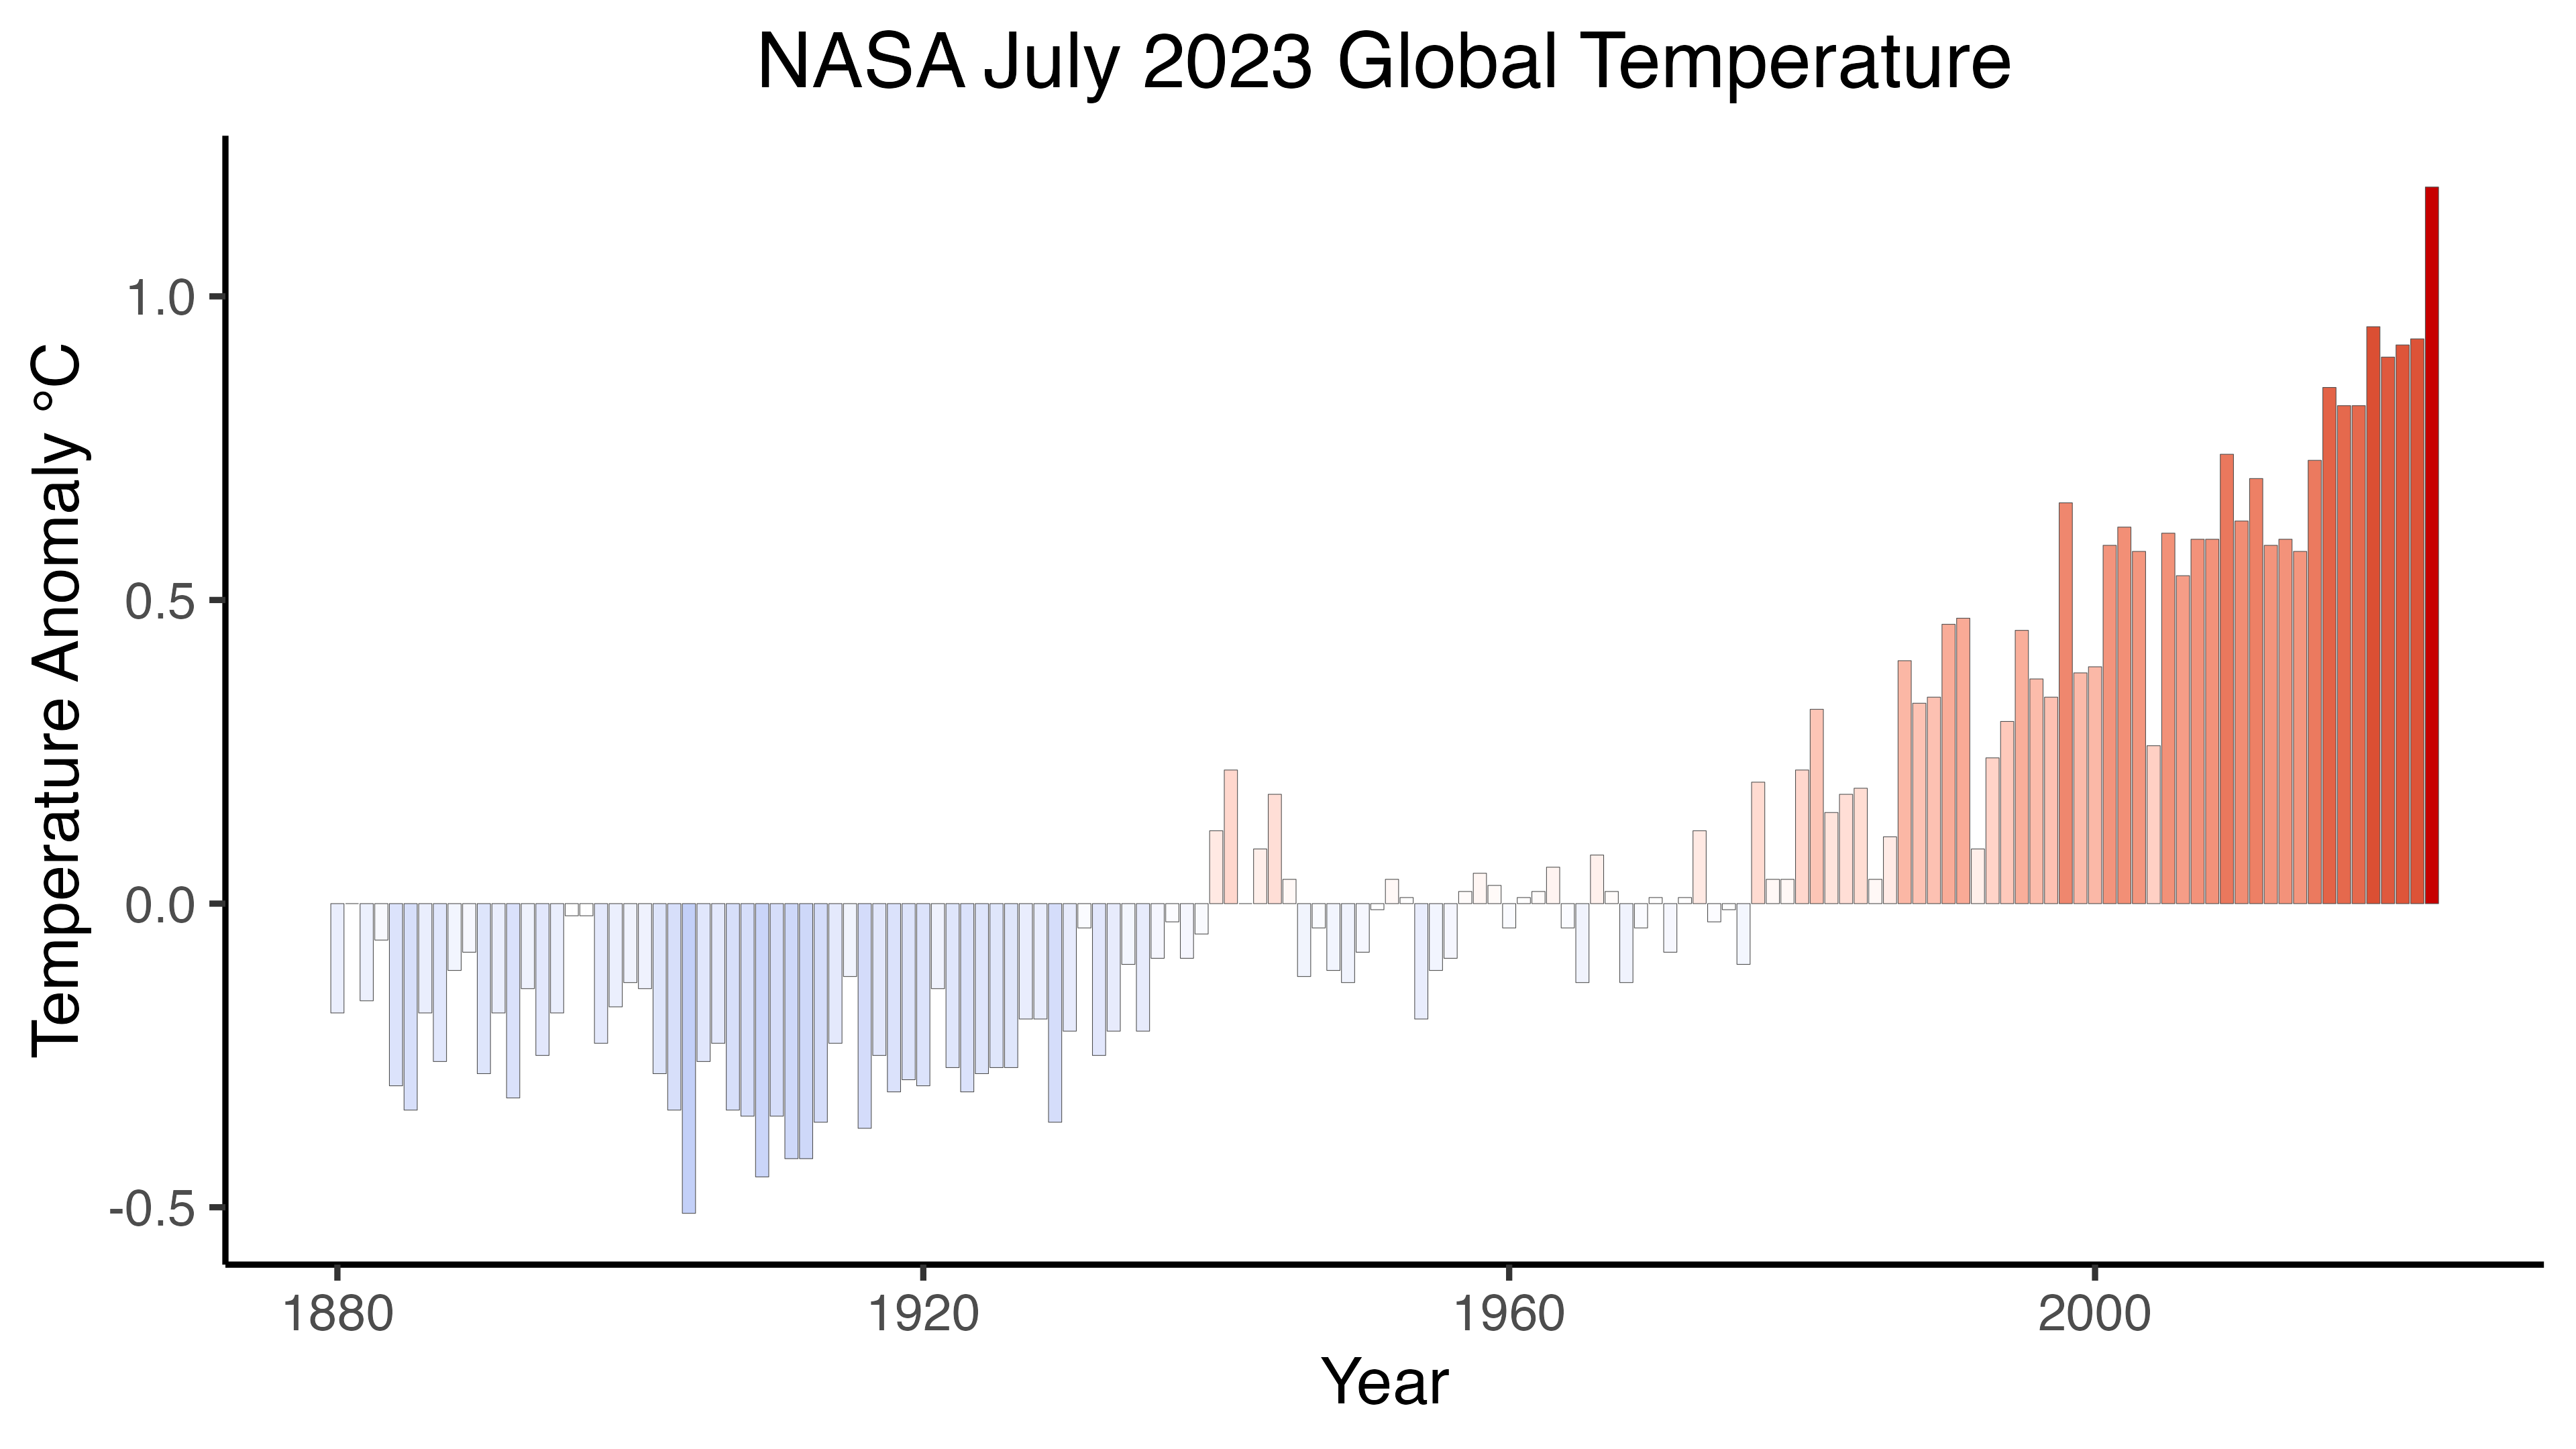
The following is a plot of the monthly global-mean temperatures (Lenssen et al., 2019), (Hansen et al., 2010). One cycle represents one year. It shows how the mean temperature is getting out of control. By left-clicking, you can restart the animation. Update: NASA has posted a news release about the July 2023 global temperature anomaly which I included.
I work with the GISS dataset.
The following plot shows the same data.
References
- Lenssen, N. J. L., Schmidt, G. A., Hansen, J. E., Menne, M. J., Persin, A., Ruedy, R., & Zyss, D. (2019). Improvements in the GISTEMP uncertainty model. Journal of Geophysical Research: Atmospheres, 124(12), 6307–6326. https://doi.org/10.1029/2018JD029522
- Hansen, J., Ruedy, R., Sato, M., & Lo, K. (2010). Global surface temperature change. Reviews of Geophysics, 48(4). https://doi.org/10.1029/2010RG000345